

Targeted SourcingJob/Position: ROI Analysis & Instructions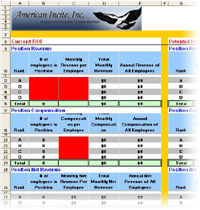 |
|
On the right-hand side of the worksheet, you can see what the Net Revenue would look like if you doubled the amount of A & B performers, while at the same time reduced your C & D performers by 50%. To complete the ROI worksheet, fill in the red sections. Begin by determining how many A performers you have in the position, followed by B, C, and D performers. (Keep in mind that this typically results in the 80/20 rule, where 80% of the work is being performed by the top 20% of your employees). If you have more than 50% A & B performers, you may want to look at what those employees are acutally producing. Next, fill out the compensation for each group of performers. (Hopefully they are producing more than you are paying them). This will tell you what the Net Revenue is for your current position. Lastly, enter the turnover % in each group. (If 1 out of 5 B performers have left in the last year, enter 20%). We've helped hundreds of companies to improve top and bottom-line growth, and if you are interested in hearing how we can work with you to achieve this, or would like to schedule a free 30 min. session to discuss these numbers, please contact us.
|